
Mhogo Chuma
@mhogochuma
1 h on charts
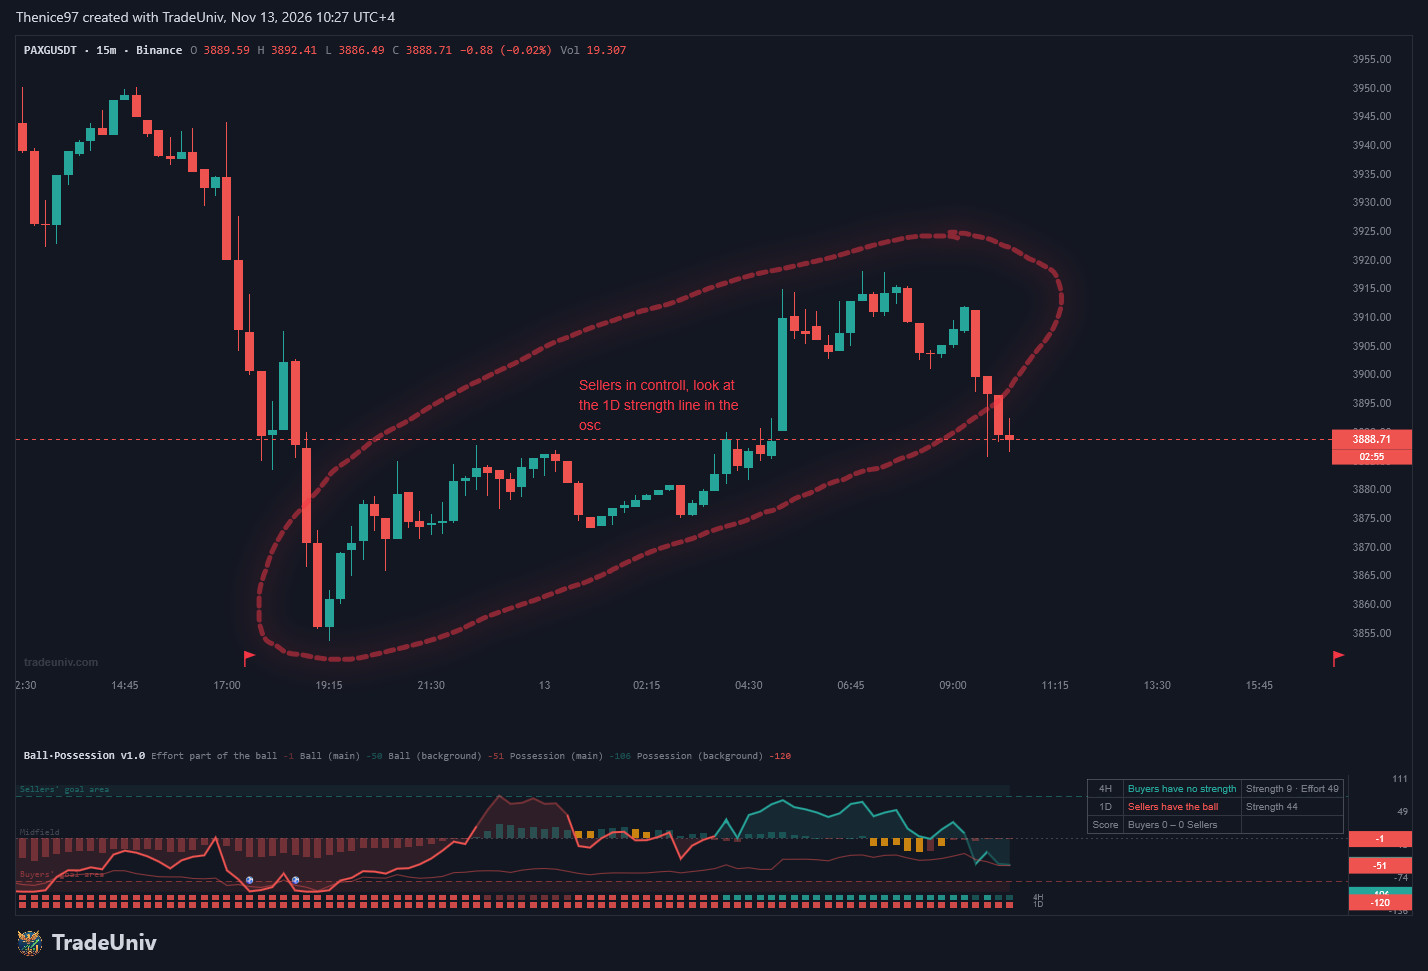
Ball & Possession turns the fight between buyers and sellers into a football match you can read at a glance. HOW TO READ IT • Ball (thick line, -100 to +100): who is pushing. Near the top, buyers are pressing the sellers' goal. Near the bottom, sellers are pressing the buyers' goal. • Line colour: who has the ball on the main timeframe (4H by default). It only changes when a candle closes beyond the previous 4H candle, so it does not flip on every wiggle. A pale line means that side still has the ball but is running out of strength. • Columns: how much of the push comes from volume (effort). Orange columns = effort rejected: one side does most of the volume, yet the ball moves back into its own half. • Two ribbons at the bottom: possession on 4H and on 1D. Same colour = both timeframes agree. • ⚽ = goal: the ball enters the goal area while the pushing side has possession. The table shows the current state in plain words and the score of the day. INPUTS THAT MATTER • Main / Background timeframe: 4H and 1D by default. Both must be at or above your chart timeframe. • Possession change: Strict (about 2 changes a day on 4H) or Standard (about 4, more false starts). • Goal area: how far the ball must go to count as a goal (80 by default). GOOD TO KNOW • Possession changes and goals are confirmed at candle close and do not repaint. The ball line moves while the current candle is forming. No higher-timeframe data is requested. • Buy / sell volume is estimated from where each candle closes in its range. It is not order-book data. • Tested on 180 days of 15-minute gold (PAXG) and bitcoin candles: none of these events predicted the next 4 hours better than a coin flip. Use it to see who is in control and how strong they are, as context for your own setup. It is not a buy / sell signal. Alerts: possession change, goal, effort rejected, both timeframes in agreement.